
Monitoring of systems and services is essential for a professional environment. A basic monitoring tells you whether or not a host (ping) or service (e.g. HTTP) is up or down. An advanced and more sophisticated monitoring does a lot of troubleshooting for you, so you save time pin-pointing the source of the problem.
Before actually going into the details how Windows servers can be monitored (spoiler: with NSClient++ agent), let's get into some basic knowledge of the open source monitoring world.
Open Source Monitoring Software (Core) and the Plugins
There are a couple of Open Source Monitoring Software available. The best known ones are Nagios, Icinga, Naemon, Sensu, Centreon, checkMK. Although they might work differently in their application "core", they (often) use the same check logic in the background: The so-called monitoring plugins.
These monitoring plugins (scripts) contain the knowledge about a certain system or application. A few examples needed?
- Need to check an Oracle database? -> Use check_oracle_health
- Need to check the hardware of an ESXi server? -> Use check_esxi_hardware
- Need to check the status of a RAID drive? -> Use check_raid
For (almost) any system and any application there is at least one specific plugin available. And if there isn't, it's very easy to write your own.
There are two different kinds of monitoring-plugins available:
- nagios-plugins: These are the original monitoring plugins which were initially maintained by the monitoring community. You can find the nagios-plugins pre-packaged in a couple of Linux distributions, such as RHEL or CentOS.
- monitoring-plugins: After a dispute between Nagios Enterprises and the open source community maintaining the nagios-plugins, the nagios-plugins project was forked and the monitoring-plugins project was created.
Both projects are now maintained at different speeds. They contain the most widely used plugins, such as check_load or check_disk for Linux/Unix systems. Application specific checks are rarely part of these two projects and can either be found on Nagios Exchange or Icinga Exchange or somewhere on a public repository (mostly GitHub or GitLab). A basic search for your application with a "check_" prefix (e.g. check_couchdb_replication) usually returns good results.
Communication between Monitoring (Core) Software and hosts to be monitored
Services, which are available over network, can be checked remotely from the monitoring server. For example to monitor the status of a central MySQL database server, the monitoring plugin check_mysql can be used to establish a connection from the monitoring server to the MySQL database, read (performance) statistics and return the result to the monitoring software.
But for services, which are only accessible on the target host (the machine to be monitored), such as status of CPU usage, a monitoring software must be installed. This software acts as a daemon/agent and accepts monitoring requests from the monitoring server, executes the checks locally and returns the result to the monitoring server.
There are basically two ways how to achieve this.
Active Checks
Using "active checks" means that the monitoring server controls when checks should happen on the target host and initiates the check request.
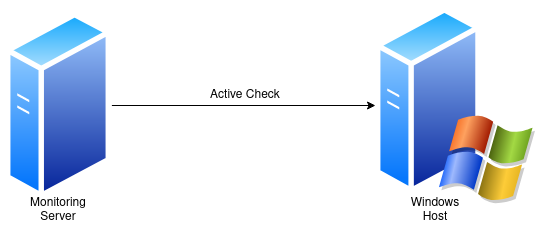
When using local checks (such as memory or cpu usage), the monitoring agent/daemon software is contacted on the target host.
Passive Checks
Passive checks means that the target host itself executes checks on its own schedule and then sends these check results to the monitoring server. A typical use-case are SNMP traps from network devices, but also servers can be added to monitoring using passive checks.

NSClient++: integration of Windows hosts into Open Source Monitoring Software
This part of the article is based on the blog article Monitoring Windows hosts with NSClient++: Service and System Checks using NRPE and REST API.
NSClient++ is that kind of monitoring agent software which is installed on Windows servers (also works on desktops). It supports active checks by enabling a NRPE (Nagios Remote Plugin Execution) and an API listener, and supports passive checks using an internal NCSA server.
One of the most common ways to integrate Windows hosts is to use NRPE: The NRPE client (the check_nrpe plugin on the monitoring server) talks to the NRPE Server (which is part of the NSClient++ installation on the Windows host) and tells the server which check command should be executed. NSClient++ then internally runs the check (e.g. check_cpu) and returns the result as response. However the NRPE project was officially called deprecated by Nagios Enterprises in 2020.
As an alternative to NRPE, NSClient++'s own REST API can be used.
Active Checks using NRPE
In order to use the current NRPE plugin (check_nrpe) with NSClient++, a couple of preparations need to happen on the Windows host first.
NSClient++ is not compatible with the new NRPE v3 protocol introduced in NRPE 3.0.0. However check_nrpe is backwards compatible to NRPE v2. This can be solved by forcing the checks on the monitoring server with check_nrpe using the -2 parameter.
Another incompatibility is the communication encryption using DH keys. Newer NRPE plugins use a DH encryption key with a size of 2048 Bytes. NSClient++ only uses a 512 Byte key on the server side. This causes the communication to break with an error "(ssl_err !=5) Error – Could not complete SSL handshake". By manually creating a new DH key and specifying it in NSClient++'s configuration file (nsclient.ini), the communication works again. Take a look at this article to see how.
Last but not least, the NRPE v2 protocol has a hard coded response size limit of 1024 Bytes. Check results with a lot of information (and performance data) would return an error in this case. To increase the so-called payload size, one needs to first increase the limit in nsclient.ini using the payload length setting:
[/settings/NRPE/server]
; Extended Payload
payload length=4096
On the plugin side, the same payload size needs to be used as parameter:
$ /usr/lib/nagios/plugins/check_nrpe -H windowshost.example.com --payload-size=4096 -2
I (0.5.2.39 2018-02-04) seem to be doing fine...
Check examples
Here are a couple of typical monitoring check examples using check_nrpe and NSClient++:
# CPU Usage with default thresholds (80% warning, 90% critical)
$ /usr/lib/nagios/plugins/check_nrpe -H windowshost.example.com --payload-size=4096 -2 -c check_cpu
OK: CPU load is ok.|'total 5m'=0%;80;90 'total 1m'=0%;80;90 'total 5s'=0%;80;90

# CPU Usage with overridden thresholds (50% warning, 80% critical)
$ /usr/lib/nagios/plugins/check_nrpe -H windowshost.example.com --payload-size=4096 -2 -c check_cpu -a "warning=load > 50" "critical=load > 80"
OK: CPU load is ok.|'total 5m'=0%;50;80 'total 1m'=0%;50;80 'total 5s'=0%;50;80

# Memory Usage with default thresholds (80% warning, 90% critical)
$ /usr/lib/nagios/plugins/check_nrpe -H windowshost.example.com --payload-size=4096 -2 -c check_memory
OK: committed = 2.774GB, physical = 2.525GB|'committed'=2.77433GB;7.3992;8.3241;0;9.249 'committed %'=30%;80;90;0;100 'physical'=2.52537GB;6.3992;7.1991;0;7.999 'physical %'=32%;80;90;0;100

# Drive Space Usage all drives with default thresholds (80% warning, 90% critical)
$ /usr/lib/nagios/plugins/check_nrpe -H windowshost.example.com --payload-size=4096 -2 -c check_drivesize
OK All 2 drive(s) are ok|'C:\ used'=31.52506GB;47.13435;53.02614;0;58.91794 'C:\ used %'=54%;80;90;0;100 'D:\ used'=0B;0;0;0;0

# Drive Space Usage on drive C with overridden thresholds (50% warning, 75% critical)
$ /usr/lib/nagios/plugins/check_nrpe -H windowshost.example.com --payload-size=4096 -2 -c check_drivesize -a "drive=c" "warning=used > 50" "critical=used >75"
WARNING c:: 31.525GB/58.918GB used|'c: used'=31.52512GB;29.45897;44.18845;0;58.91794 'c: used %'=54%;50;75;0;100
Active checks using NSClient++ REST API
In the recent years of NSClient++ development, focus has shifted towards its own REST API. The API can be enabled with the WebServer module:
; Modules
[/modules]
CheckExternalScripts = 1
CheckHelpers = 1
CheckNSCP = 1
CheckDisk = 1
CheckSystem = 1
CheckWMI = 1
NSClientServer = 1
CheckEventLog = 1
NSCAClient = 1
NRPEServer = 1
CheckLogFile = 1
SimpleFileWriter = 1
SimpleCache = 1
WEBServer = 1
A list of allowed hosts can be configured. This defines which remote hosts are allowed to access the API. API related configuration happens in nsclient.ini within the [/settings/WEB/server] context:
# Section for WEB (WEBServer.dll) (check_WEB) protocol options.
[/settings/WEB/server]
allowed hosts=127.0.0.1,192.168.1.0/24
cache allowed hosts=true
certificate=${certificate-path}/certificate.pem
port=8443
threads=10
The API can (should) be password protected. This can be set either in the in the [/settings/default] or in the [/settings/WEB/server] context:
; PASSWORD - Password used to authenticate against server
password = 1234
Note: If the password is defined in the [/settings/default] section, the password also applies to all other checks, not only the API.
With the Web server enabled and NSClient++ restarted (use services.msc, find NSClient++ and restart the service), the API listens on the (default) port tcp/8443. But it's not only the API which is interesting; on port 8443 a full web application is now available.
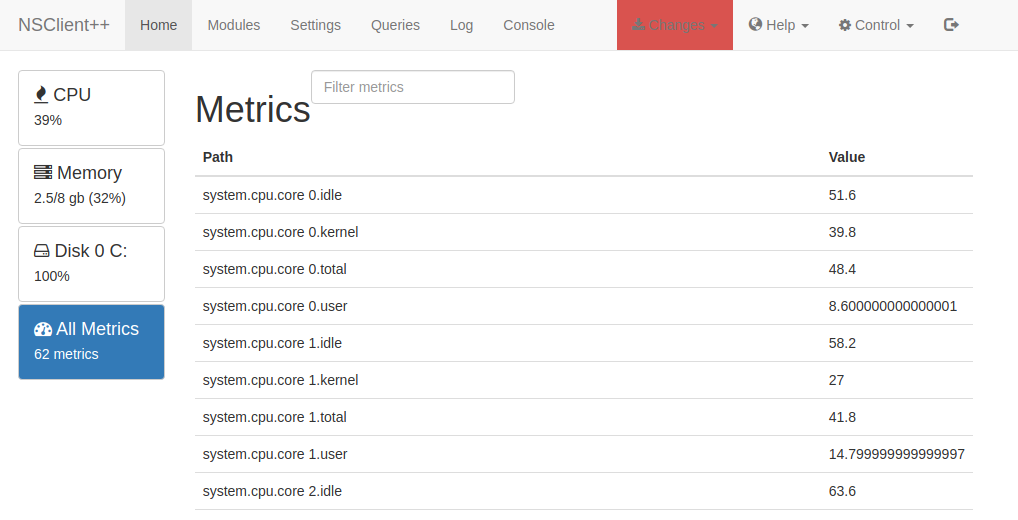
This Web User Interface does not only show current system metrics, it also allows to manually launch specific checks, using the Queries tab:
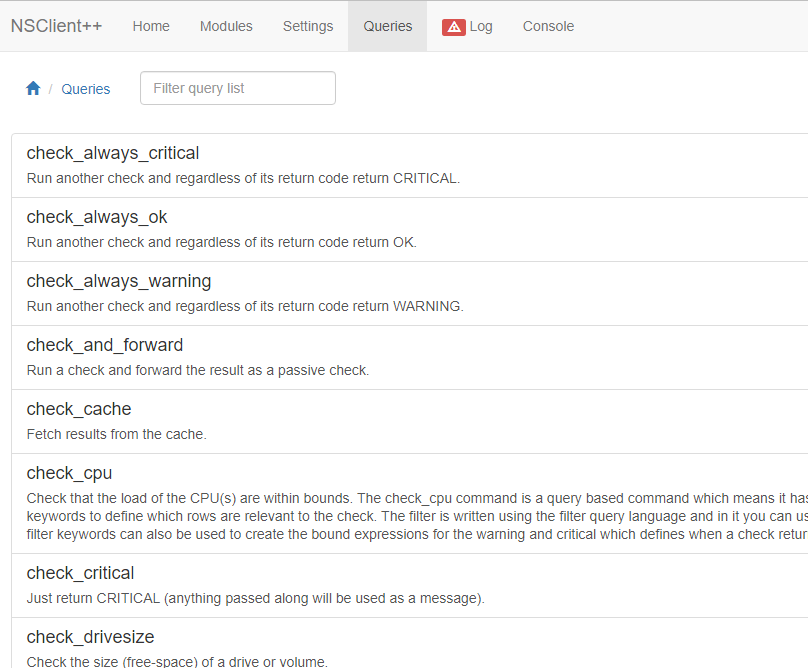
To be able to use the API to execute checks, another monitoring plugin than check_nrpe needs to be used, obviously. As of this writing, two monitoring plugins are available:
- check_nscp_api is a monitoring plugin developed by Icinga. It is part of the Icinga installation package, but the plugin can be compiled from its source code.
- check_nsc_web is an alternative monitoring plugin, but developed independently of Icinga.
Check examples
The following example use the check_nscp_api. The same checks as above (with check_nrpe) are used to have a direct comparison.
# CPU Usage with default thresholds (80% warning, 90% critical)
$ /usr/lib/nagios/plugins/check_nscp_api -H windowshost.example.com -P 8443 --password 1234 -q check_cpu
check_cpu OK: CPU load is ok. | 'total 5m'=0%;80;90 'total 1m'=0%;80;90 'total 5s'=0%;80;90

# CPU Usage with overridden thresholds (50% warning, 80% critical)
$ /usr/lib/nagios/plugins/check_nscp_api -H 192.168.15.18 -P 8443 --password 1234 -q check_cpu -a "warning=load > 50" "critical=load > 80"
check_cpu OK: CPU load is ok. | 'total 5m'=0%;50;80 'total 1m'=0%;50;80 'total 5s'=0%;50;80

# Memory Usage with default thresholds (80% warning, 90% critical)
$ /usr/lib/nagios/plugins/check_nscp_api -H 192.168.15.18 -P 8443 --password 1234 -q check_memory
check_memory OK: committed = 2.664GB, physical = 2.289GB | 'committed'=2.663784GB;7.399207;8.324107;0;9.249008 'committed %'=29%;80;90;0;100 'physical'=2.288502GB;6.399207;7.199107;0;7.999008 'physical %'=29%;80;90;0;1007GB;6.3992;7.1991;0;7.999 'physical %'=32%;80;90;0;100

# Drive Space Usage all drives with default thresholds (80% warning, 90% critical)
$ /usr/lib/nagios/plugins/check_nscp_api -H 192.168.15.18 -P 8443 --password 1234 -q check_drivesize
check_drivesize OK All 2 drive(s) are ok | 'C:\ used'=32.004597GB;47.134354;53.026148;0;58.917942 'C:\ used %'=54%;80;90;0;100 'D:\ used'=0B;0;0;0;0

# Drive Space Usage on drive C with overridden thresholds (50% warning, 75% critical)
$ /usr/lib/nagios/plugins/check_nscp_api -H 192.168.15.18 -P 8443 --password 1234 -q check_drivesize -a "drive=c" "warning=used > 50" "critical=used >75"
check_drivesize WARNING c:: 32.005GB/58.918GB used | 'c: used'=32.004822GB;29.458971;44.188457;0;58.917942 'c: used %'=54%;50;75;0;100
Note that the arguments (-a) are exactly the same as using check_nrpe. This makes a migration from NRPE to API much simpler.
Alternatives to NSClient++
NSClient++ is a lightweight yet very powerful agent/daemon. But it is an additional software to be deployed on every Windows machine to be monitored. If this is for any reason impossible to do, an alternative is to use WMI to monitor the Windows hosts.
A monitoring plugin (check_wmi) already exists for exactly this situation. By using WMI (Windows Management Instrumentation) as Windows monitoring basis, no additional software needs to be installed (WMI is part of every Windows OS since Windows 2000). This allows agent-less monitoring.
The downside of WMI is the fact that a proper and complete monitoring using WMI queries is only possible by using a privileged user, also known as local Administrator or domain Administrator. This is of course a huge potential security risk, in case the credentials are read from the monitoring server. However a monitoring server should in general only run in internal networks with very strict access restrictions.


