If you manage servers and services, whether they're on running in the Cloud or on-premise (or in your basement), you want to get data. Typically you already have a monitoring or observability in place. Now you want to display your dashboards and metrics.
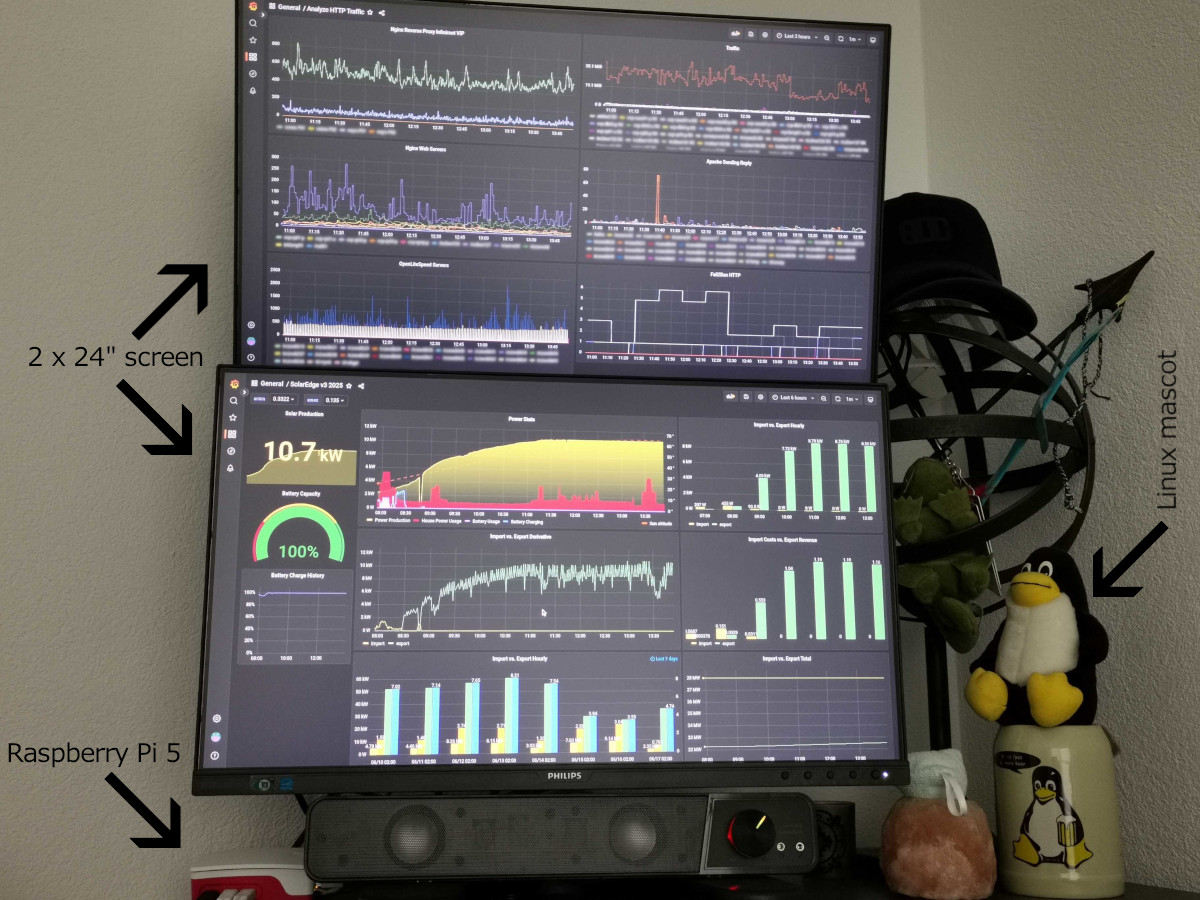
In my office I have dedicated a corner for displaying live monitoring statistics and dashboards. That corner – I call it my monitoring station – is pretty compact and is power efficient.
The equipment
Here's a list of equipment you need to build your own monitoring station.
- A mini computer, such as a Raspberry Pi 5 or similar
- Two monitor screens, such as the Philips 241B8QJEB or similar
- Two Micro-HDMI to HDMI cables to connect the mini computer to the screens
- A vertical dual monitor stand, such as the Neomounts Newstar FPMA-D700DDV or similar
Note: Product links go to Amazon.com
The mini computer
Luckily the Raspberry Pi 5 (Amazon product link) received an impressive performance boost, compared to its predecessor, the Raspi 4. This allows to handle multiple screens (2 x Micro HDMI output) and browsers without lagging. Make sure to buy two Micro-HDMI to HDMI cables (Amazon link) or as an alternative get two Micro-HDMI to HDMI adapters (link to product on Amazon).
Of course you can use any micro computer for this purpose. In almost any case you only need to have a browser or multiple browser windows open. Another but more expensive alternative would be an ASUS NUC (link to product on Amazon) with 2 x HDMI output.
Note: You might be wondering about the sound bar at the bottom. This was added to improve the sound quality and volume of the Raspberry Pi 5.
Vertical dual screen mount
Thanks to the dual HDMI output of the Raspberry Pi 5, using two screens made sense from the beginning, each connected with its own HDMI cable. Another possibility would have been to use a HDMI splitter, in case you want to use a mini computer with a single video output.
The next question was whether to use a vertical or horizontal alignment for the screens. If you actively work on a computer with two (or more) screens, you'd almost certainly go with a horizontal alignment. Meaning: You have a screen on the left and on the right.
But to have a quick glance at metrics and statistics it actually turns out that a vertical setup is faster to read. Another reason was to efficiently use the corner space of my office. A vertical dual-screen setup offered a much better space optimization.
Once decided for the vertical screen alignment, it was time to find a so-called monitoring/screen stand. I eventually found the Newstar FPMA-D700DDV (link to product on Amazon) dual screen stand from Neomounts.
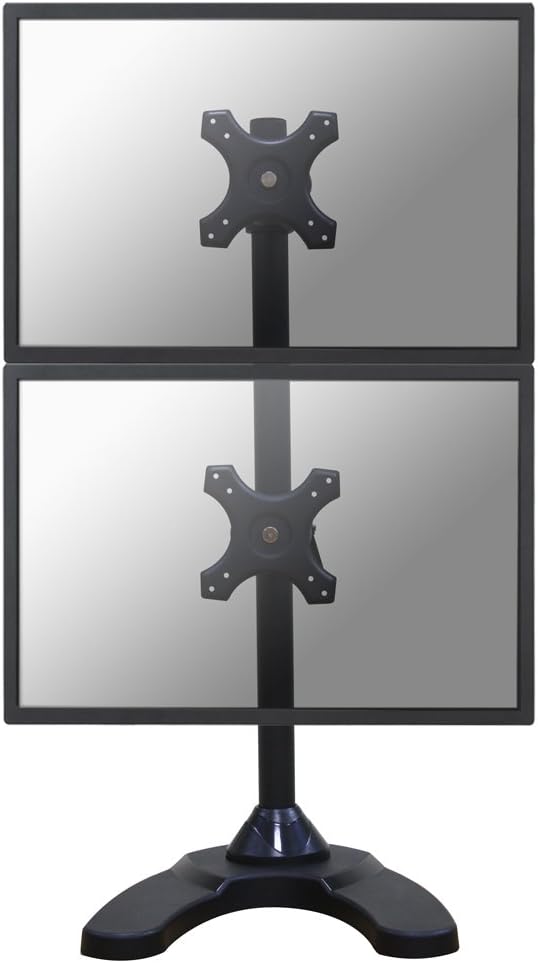
Compared to other similar monitor stands, this one offers a wide range of screen sizes, up to 27 inches! Due to the weight of the stand, it guarantees stability. Also, when I compared prices, the Neomounts Newstar was in the bottom 50% range.
Dual Monitor
As I already had one monitor in place, a Philips 241B8QJEB (link goes to Amazon product), I went for the exact same product again. Having two different screen models on top of each other would make me go nuts visually…
There are a couple of reasons why I chose to continue with this monitor. When I bought it, the price was one of the best in the category of LCD monitors, the image quality is pretty good and it has a lot of connectivity options! The integrated sound is pretty bad, I admit that, but that's why I have an additional sound bar in place (see picture of my monitoring station at the beginning).
The setup
Physical monitor setup
Obviously you need to attach the two LCD screens on the monitor stand. I advise to to this as a two person job, as it will be much faster with someone holding the screen and the other person fixing the screws on the VESA holder.
If you want to do it the hard way (alone), I recommend to start with fixing the lower screen first. It will put additional weight on the stand and help hold the stand in place when you attach the top screen. Let me just say: Been there, done that.
In my setup I tilted the top LCD screen slightly to "face below". To be able to tilt one of the monitors you need to look at the round-ish VESA holder and on the side you need to remove the side covers. It's not obvious, but you can actually remove the round side caps.
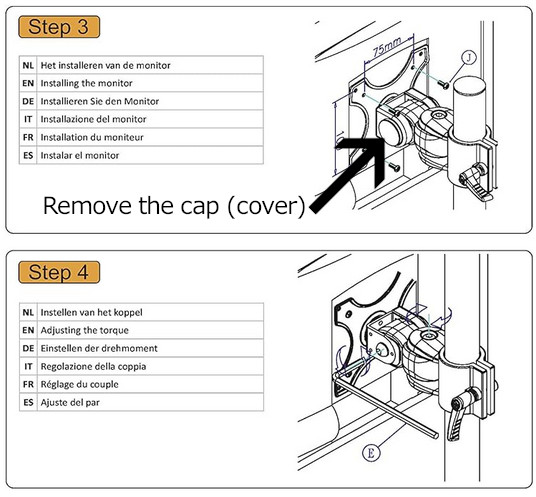
After you remove the covers, you can see a screw, which you can loose and then tilt the screen. Fix the screw again once you have reached the wanted degree.
With your two monitor screens attached to the monitor stand you can now connect the HDMI cables from the Raspberry Pi to the screens.
Software Setup
With Raspberry Pi OS started, you should first align the monitors according to their vertical setup. You can do this under Preferences -> Screen Configuration. You can grab one of the HDMI detected screens and place them according to your physical setup.
Next up is the browser setup. Over the last couple of months running this setup, I saw random freezes in Chromium but also in Firefox. It helps to run the two in parallel.
In my setup I use Chromium with a single tab, displayed on the top monitor. This basically shows the same dashboard the whole time, the dashboard with the highest priority for me. The Grafana dashboards are configured to automatically refresh every minute.
On the bottom monitor, Firefox is started with multiple tabs. This Firefox has the "Tab Rotator" add-on installed. This add-on allows to automatically jump from one browser tab to another in a specific interval (15s in my setup). In Firefox a couple of tabs are configured and are launched at every Firefox start (Settings -> Home -> New Windows and Tabs).
Both Chromium and Firefox are set to full screen mode ([F11] key). Of course you can also reverse the roles and install a Tab Rotator add-on in Chromium as well.
Faster Troubleshooting
Does such a "monitoring station" setup make sense for everyone? No, I guess not. But if part of your work is operating an application, a server or a complete infrastructure, you will find it very helpful.
There have been multiple occasions when alerts were triggered that reached my phone (SMS for highly critical alerts) and a quick look at the monitoring station already saved me a couple of minutes of troubleshooting. By placing the relevant metrics and monitoring dashboards on your monitoring station you immediately see spikes (or drops), potentially already explaining what's happening.


